
Read the chart zones
The colored areas illustrate support and resistance on a BTC daily chart. S/R availability is pending; these are sample levels.
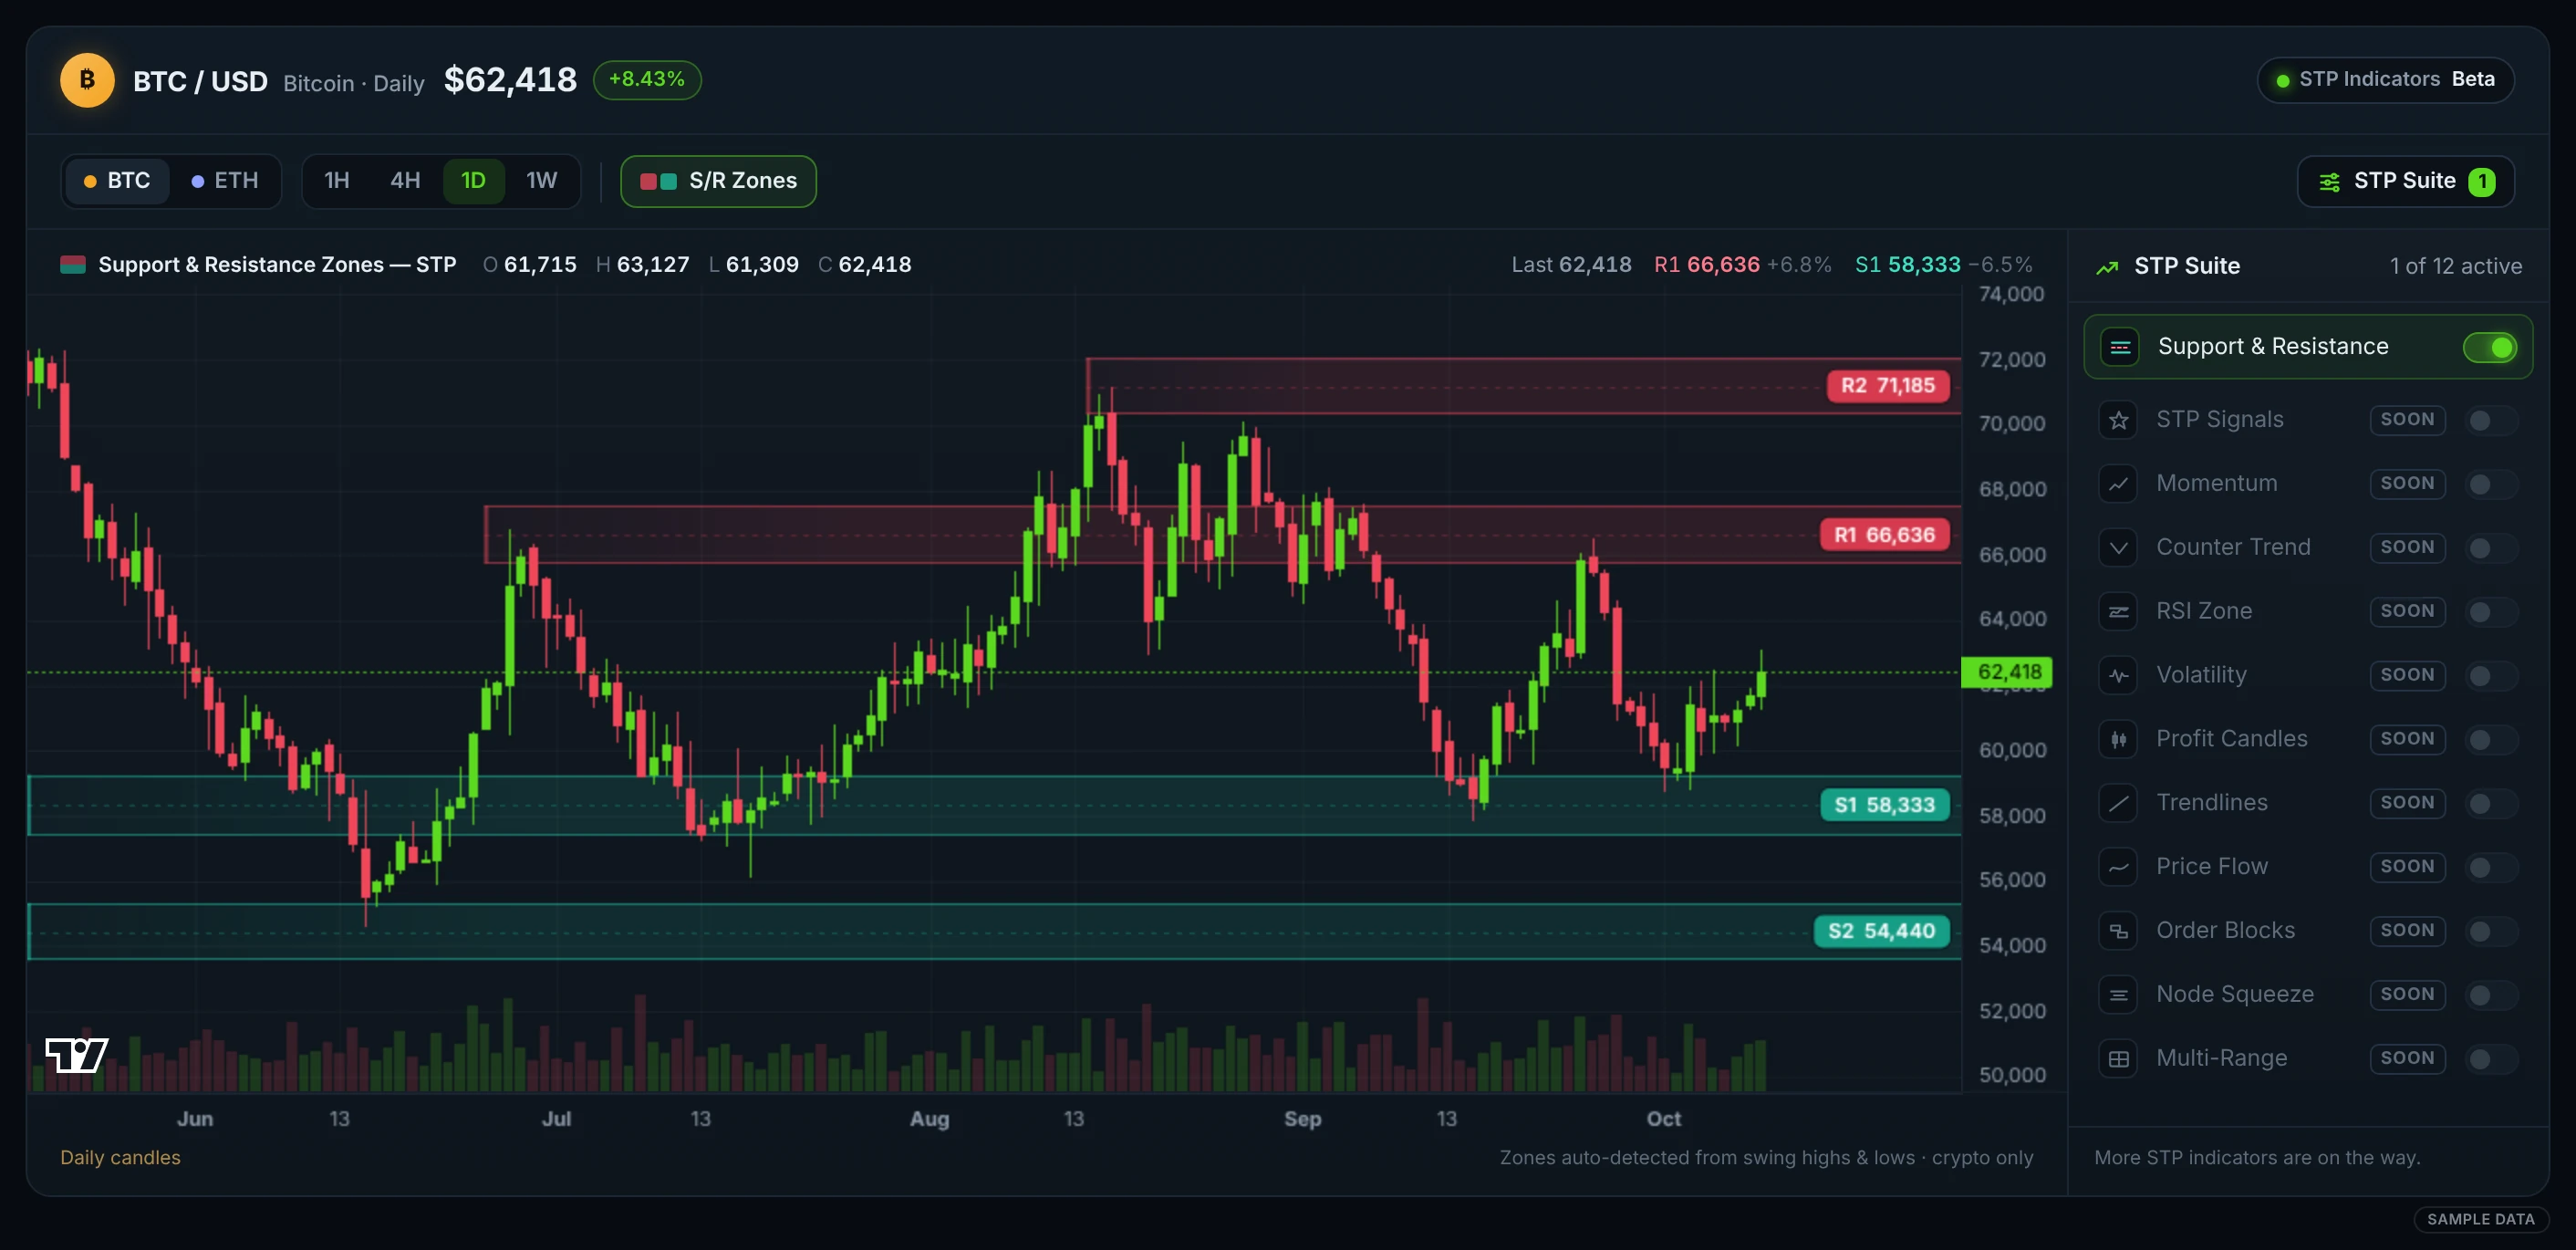

STP Support & Resistance for the BTC and ETH daily chart is coming soon. See how the zones look in these sample views.
See plans →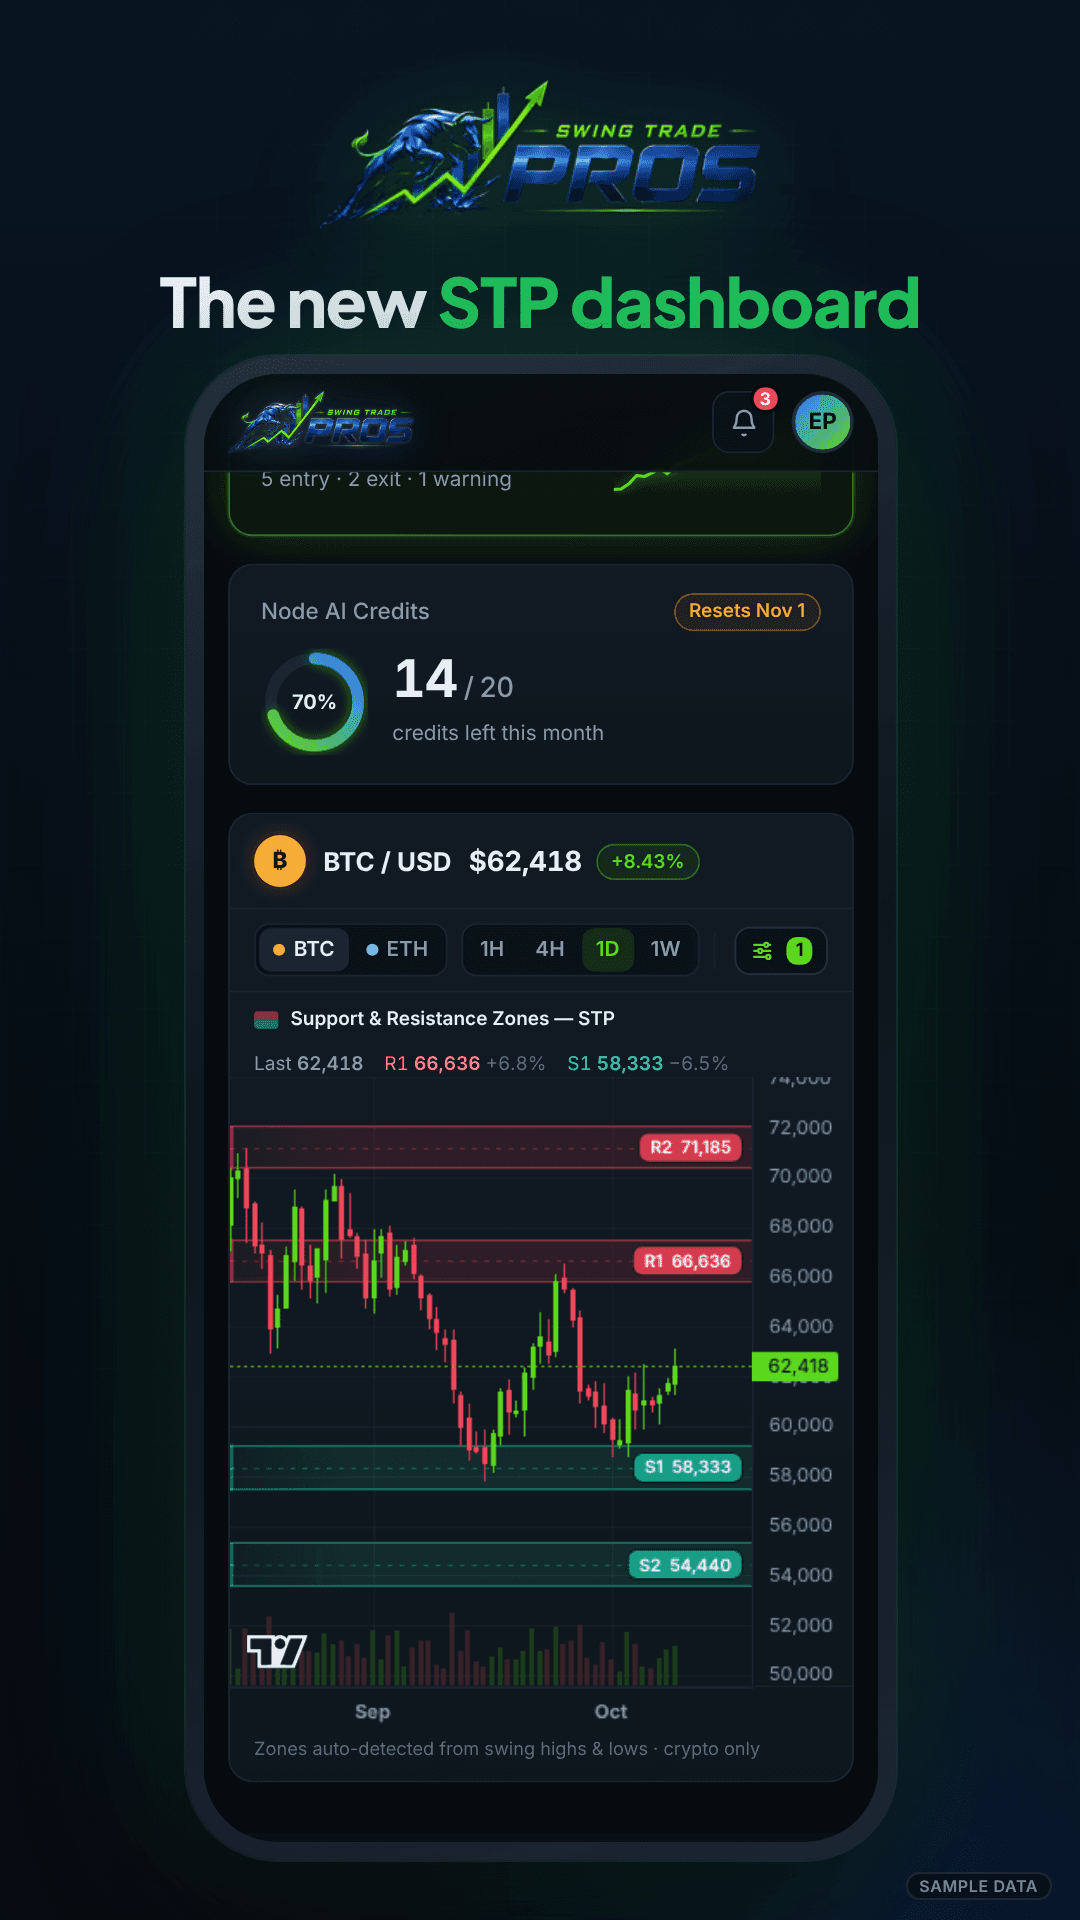
The colored areas illustrate support and resistance on a BTC daily chart. S/R availability is pending; these are sample levels.
Premium includes analyst alerts in Discord and the STP dashboard, with the STP Suite added as indicators launch. Elite is coming soon.
STP explains chart structure. You decide what to do and place every trade yourself.